Beyond statistical research on patent databases for the purpose of identifying global economic trends, an even more interesting application of patent analysis is the search for indicators associated to a given sector. In particular, since patents are a priori a reflection of innovation, the corresponding indicators need to reflect the latter’s economic models, in particular the product lifecycle models (PLC model) commonly used in strategic marketing and strategic planning.
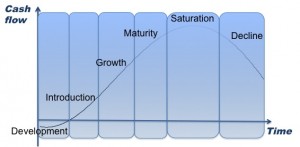
This model divides the life cycle of a product in various phases corresponding to specific cash-flow levels: development, growth, maturity, saturation, decline (Figure 1).

Figure 1. Product lifecycle phases.
In the first phases of development and introduction, the innovations are radical and come from a limited number of stakeholders. As far as patents are concerned, this translates into a limited number of patents, clustered among a small number of applicants, with fundamental claims of wide reach that will then be widely referenced.
Once the technical and commercial uncertainties are resolved, the growth phase is marked by incremental innovations – in particular secondary applications and manufacturing processes optimization -, developed both by the pioneers and new entrants in the field. As far as patents are concerned, this translates into an increased number of filings, a larger pool of applicants, and a reduced scope of the claims, until is reached a stability level corresponding to the maturity phase.
Finally, once the innovation potential in the field is exhausted, the saturation and decline phases translate into a decrease in the number of patent filings.
Practical evidence supporting the above modeling is available from a number of experimental studies in the econometrics literature. On the macroscopic level, by studying the patent stocks accumulated over a sliding period of 30 years in 56 groups covering all 399 USPTO technological classes recorded from 1980 to 1990, Andersen extracted 106 representative curves of technical development cycles in “S”, characterized by a succession of depression, recovery, prosperity and recession phases interrupted by crises. Grouping the data slightly differently and using more data (from the 1960s to 1999), Hall showed that the proportion of patents associated with conventional sectors such as chemistry and mechanics has constantly decreased compared to that of patents in information and biomedical technologies, in accordance with the latters’ expansion since the early 90s.
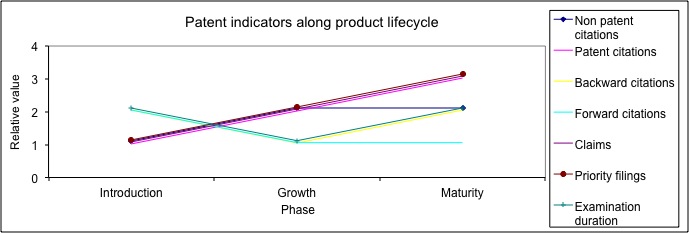
More recently, on a more practical level for corporate application, Haupt et al. developed a complete study of the patent indicators linked to a very specific technology at maturity stage, the pacemaker, and derived practical patent indicators that allow for the identification of the introduction, growth and maturity phases of the product lifecycle that don’t require a full analysis of the patent filings in the corresponding domain – the patent filing analysis of the two main competitors in the field is sufficient, which makes it a very practical approach to quickly assess a given sector without having to realize an exhaustive landscape. The indicators proposed by the authors are as follows (Figure 2):
- Backward citations to the literature excluding patents – assumed to increase between the introduction and the growth phase, then to stagnate.
- Backward patent citations – assumed to increase throughout the cycle from product introduction to maturity.
- Age difference between patent and backward citations – assumed to be significantly shorter in the growth period (frequent incremental innovations) than in the introduction and maturity phases.
- Forward citations – assumed to decrease between the introduction phase (radical innovations, foundations of the technology which have to be widely referenced) and the growth phase (incremental innovations, more specific branches that are referenced only by subsequent improvements, necessarily less numerous).
- Dependent claims – assumed to increase with the product maturity, since the domain is already mostly patented, in order to offer a fallback position to the applicant.
- Priorities – the filing of refined texts linked to a first priority is essential practice, especially since the environment is very competitive. This is why Haupt hypothesizes that the number of citations to anterior priorities increases as the product matures.
- Investigation duration – Haupt hypothesizes here that the investigation phase is longer in the introduction phase, characterized by radically new and large claims requiring unusual research by the patent officer, but also in the maturity phase, characterized by an abundance of prior art to analyze.
The experimental validation of those hypotheses through analysis of the patents of the two main competitors in the pacemaker field showed that they are particularly valid in the case of the passage from growth to maturity phase. The results were however less significant for the passage from introduction to growth phase. Furthermore, because of the technology used for experimentation, the pacemaker, it wasn’t possible to study the following phases, given its youth at the time of the study. However, other, more recent studies have shown the validity of Haupt’s approach in other technological fields and on a longer lifecycle, but are unfortunately not available, to the IPStudies knowledge, in the public domain.
Two additional indicators, mentioned more recently in the OECD patent statistics manual should permit a more detailed analysis:
- Technological accumulation: the tendency of a company to reference its own patents can indicate an effort to maintain its leadership position in a given sector and can, in extreme cases, introduce a bias in the measurement of indicators based on citations;
- Technological cycle duration: the median value of backward citations can indicate, when applied to a given company, its technical innovation speed with regards to the state of the art compared to its competitors. This value is in practice very dependent on the sector (8 years on average, but only 3-4 years in semi-conductors, for instance).

Figure 2. Patent indicator transitions with respect to the product lifecycle phases.
Therefore, patent citations analysis is useful to anticipate the technology product development trends, in particular in regards to the lifecycle transitions. One of the main advantages of the evaluation of a technological market’s lifecycle phases using patent indicators is that the data relative to patents is available ahead of the market data, since they are directly linked to the companies R&D investments, and so ahead of products commercialization. This type of analysis is of particular interest when correlated with other, more conventional information sources such as market intelligence, especially when performing strategic planning or positioning mid- to long-term investments, and is now part of the IPStudies patent analytics services.
References:
B. Andersen, “The hunt for S-shaped growth paths in technological innovation: a patent study”, Discussion paper No.12, Center for Research on Innovation and Competition CRIC, University of Manchester, May 1998.
B. H. Hall, A. Jaffe, M. Trajtenberg, “The NBER patent citations data file: lessons, insights and methodological tools“, NBER, 2001.
R. Haupt, M. Kloyer, M. Lange, “Patent indicators for the technology life cycle development“, Research Policy, Vol. 36, Issue 3, April 1997, pp. 387-398.
